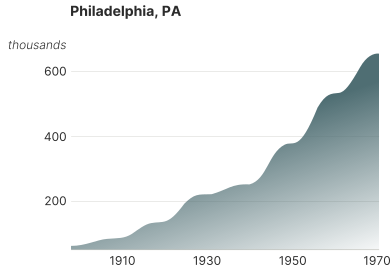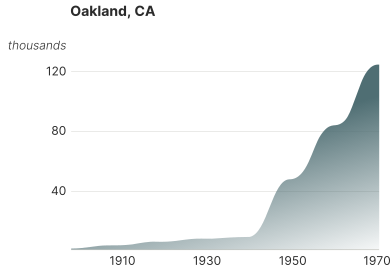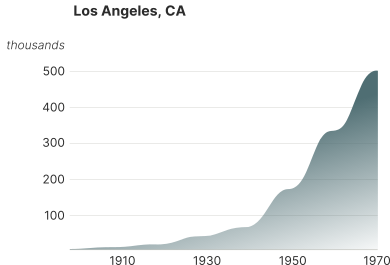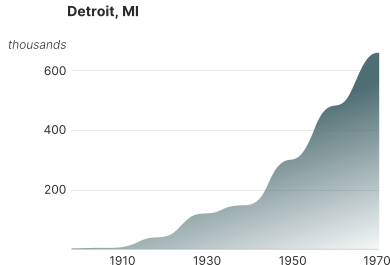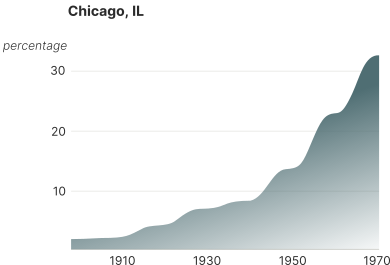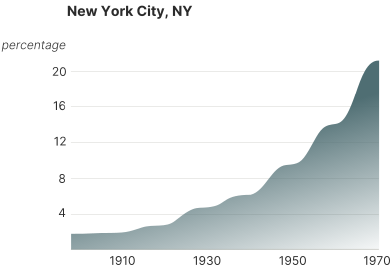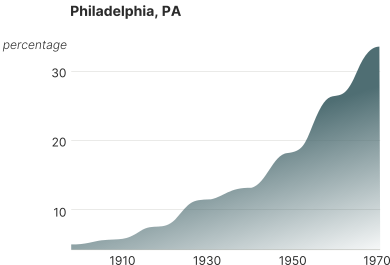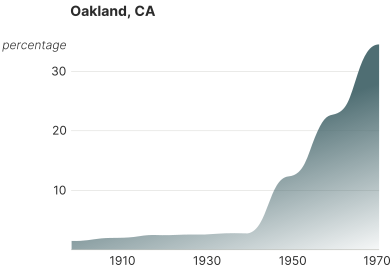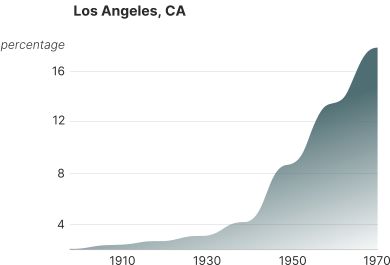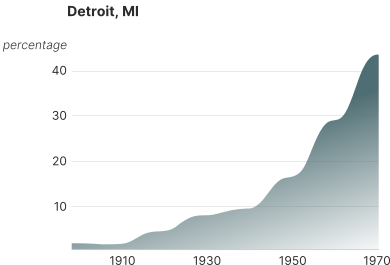
Between 1910 and 1970, six million African Americans left the South
in what became one of the largest internal migrations in U.S. history.
At the turn of the century, ninety percent of African Americans lived in the South, confined to sharecropping under Jim Crow's legal discrimination and constant violence.
As World War I slowed European immigration, defense sector jobs multiplied across Northern cities and factories actively sought new labor. Drawn by more opportunities, and the prospect of escaping the South, African Americans started moving to industrial cities.
By the end of World War I, more than 1.5 million African Americans had left the South. As they settled into factory work and urban life, they faced hostility from white workers resisting integration.
The Great Depression eliminated jobs across the country and slowed migration. Yet mechanization kept displacing Southern farmers off the land. Those already North built institutions and communities that would outlast the crisis.
World War II sparked the second wave. Defense factories expanded nationwide, creating jobs in new regions. Migration accelerated, spreading populations to new regions and urban centers.
After the war, three million more people left the South, encountering discriminatory housing policies that created segregated neighborhoods and lasting disparities.
Migration patterns evolved: Western cities emerged as major destinations of settlements alongside Northern hubs.
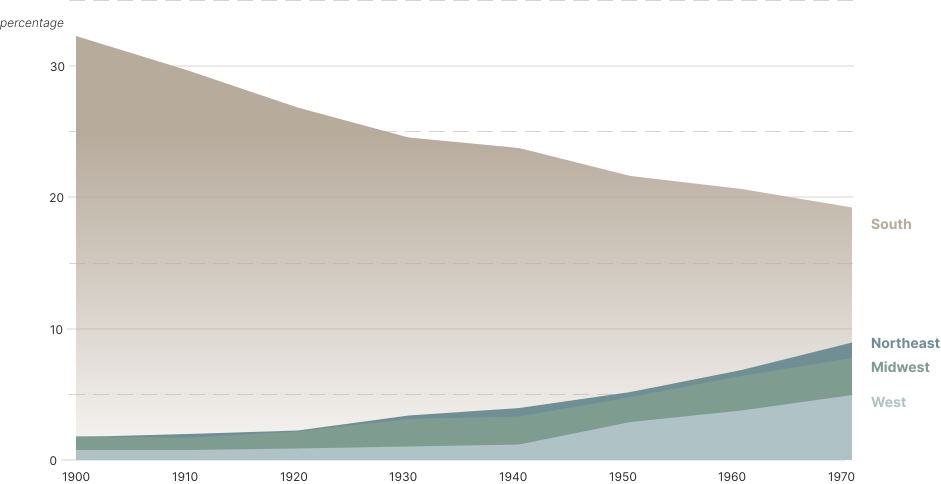
53 percent of African Americans remained in the South, down from 90 percent in 1900. Urban centers had become the primary home of Black communities across the nation, that would shape American culture, music, and politics for the upcoming decades.
The Great Migration followed two distinct patterns separated by the Great Depression. The first wave built concentrated Northern communities with political and cultural power, while the second wave spread nationwide, extending both black people presence and the residential segregation that had emerged in the North.
Increasing (in %)
10.0 or more
5.0 to 9.9
2.5 to 4.99
0.0 to 2.4
Decreasing (in %)
-2.4. to -0.1
-5.0 to -2.5
-10.0 to -5.1
Less than -10.0
Violence and legal oppression
Cotton crop collapse
Denial of political participation
Northern factory works
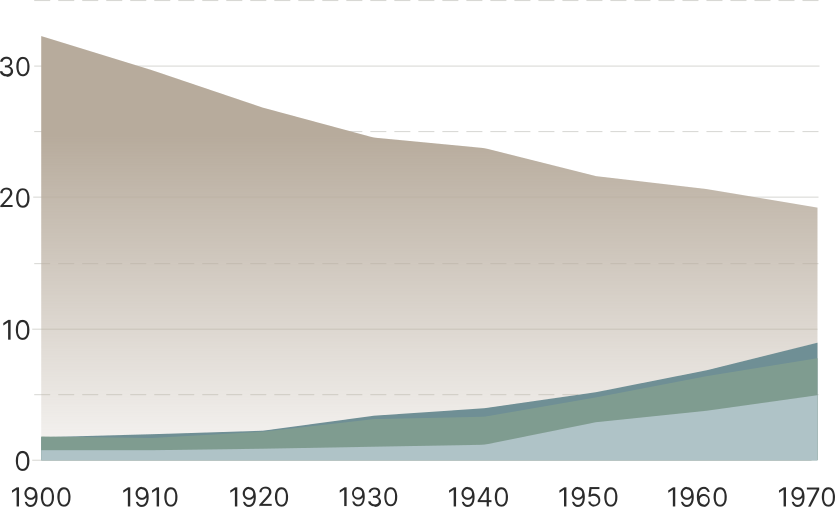
Each region's trajectory mirrored economic shifts and migration waves. The Northeast and Midwest expanded during the first wave as factory employment drew migrants to established industrial cities. The West's growth accelerated after 1940, driven by defense sector growth and offering an alternative to the segregated housing markets already entrenched in the North.
percentage
South
Northeast
Midwest
West
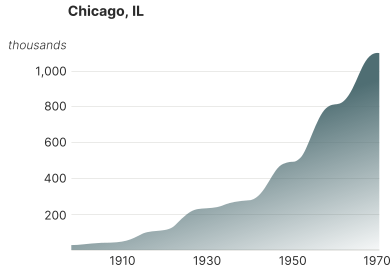
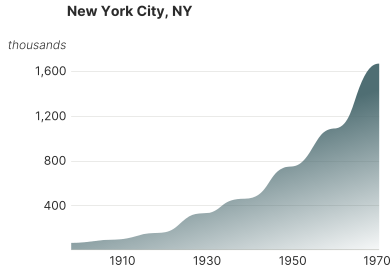
Migration forged the major African American urban areas that exist today, establishing both centers of cultural and political influence and the residential segregation patterns that continue to shape metropolitan areas.
The universal decline across Southern states revealed how migration was driven by the region's systemic conditions, as opportunities elsewhere offered better wages, education, and safety.
Mississippi
58.5% to 36.8%
South Carolina
58.4% to 30.5%
Louisiana
47.1% to 29.8%
Georgia
46.7% to 25.9%
Alabama
45.2% to 26.2%
Florida
43.7% to 15.3%
Virginia
35.6% to 18.5%
North Carolina
33.0% to 22.2%
Arkansas
28.0% to 18.3%
Tennessee
23.8% to 15.8%
Texas
20.4% to 12.5%
Maryland
19.8% to 17.8%
Delaware
16.6% to 14.3%
Kentucky
13.3% to 7.2%
Oklahoma
7.0% to 6.7%
West Virginia
4.5% to 3.9%
Data for this project come from official U.S. decennial census publications compiled by the U.S. Census Bureau. State-level data include total population and population by race for each census year from 1900 through 1970. For each state, the share of the Black population was calculated as a percentage of total population, and changes were measured across two periods: 1900–1940 and 1940–1970.
States were identified as major departure regions if they showed sustained declines in Black population share, and as destination regions if they showed sustained increases over the same period.
City-level data were collected in parallel from decennial census volumes for urban places within the states showing the strongest changes. Cities were selected based on measurable growth in Black population and their historical role in industrial expansion.
Migration flows shown in the maps are inferred from corresponding declines and increases at the state and city level. Locations are approximate and mapped to modern state boundaries for geographic reference.
Source: US Census Bureau, Harvard University, Library of Congress, US National Archives.